Creating A Metrics Dashboard With Ember.js, Bootstrap, and Rails - Part 3
28 Apr 2014This is part three of a series on building a metrics dashboard with Ember, Bootstrap, and Rails. Over the next few weeks I will be building out more functionality and writing posts to cover that. If you haven’t read part one and part two then that’s a good place to start.
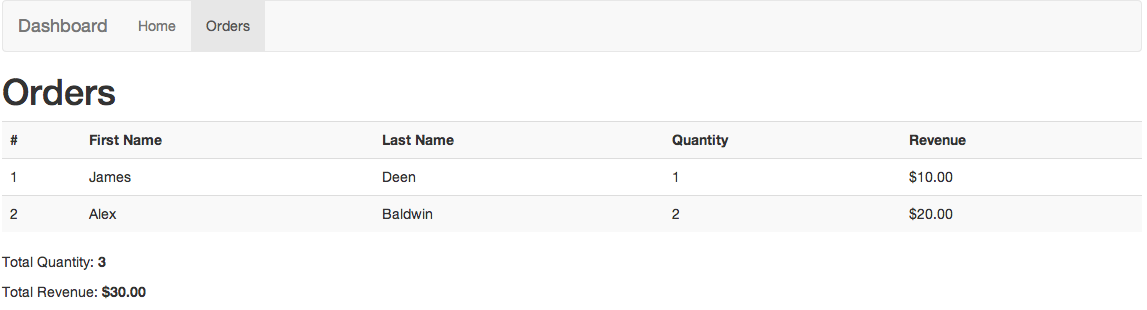
In part two we ended up with an Ember app that rendered dynamic tables. If you followed along, your page should now look like this:
Today we’re going to add some graphs and see how Ember components work.
Remember, if you get stuck you can find all of the code for this post at github.com/jtescher/example-ember-rails-dashboard.
Choosing The Right Library
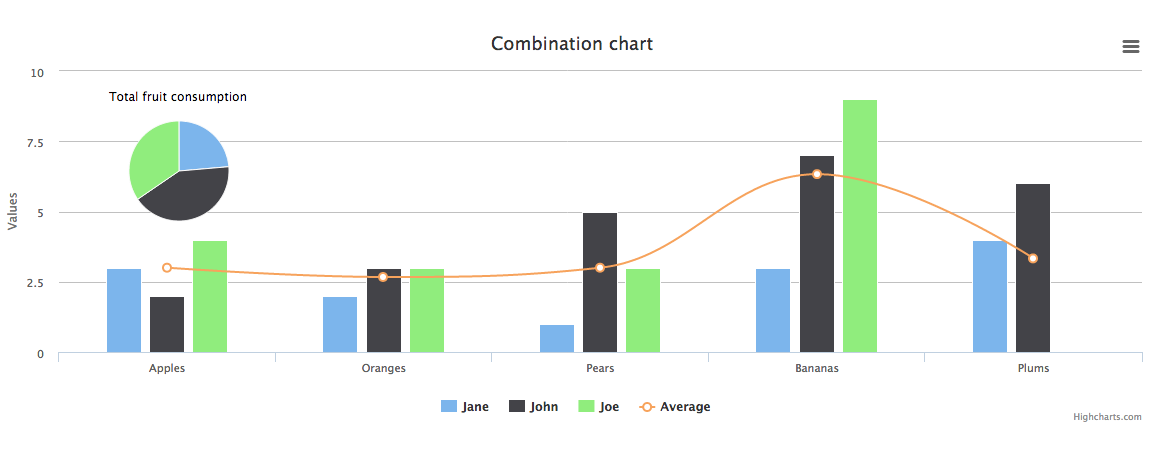
There are many good options when it comes to JavaScript graphing, charting, and visualizations. I find highcharts to be a good place to get started and it is free for non-commercial uses! If you find yourself needing more control or having a very specific requirement you can always look at projects like d3.js.
Adding Highcharts
Let’s download the latest version of highcharts to our vendor/assets/javascripts directory.
$ curl http://code.highcharts.com/4.0.1/highcharts.js \
    -o vendor/assets/javascripts/highcharts-4.0.1.js
And then require the file in app/assets/javascripts/application.js
...
//= require jquery
//= require accounting-0.3.2
//= require highcharts-4.0.1
//= require_tree .
Creating The Ember Component
Ember makes adding reusable components quite simple. We can add a component that represents a specific chart we want to show on the screen and have ember re-render the chart whenever the data changes. You can read more about how the Ember components work here.
As an example we can add a highcharts column chart to show revenue by product. First let’s add the component in our
app/assets/javascripts/templates/orders.hbs file:
<h1>Orders</h1>


<table class='table table-striped'>
...
Then we can add the template for the component in app/assets/javascripts/templates/components/column-chart.hbs:
<div style='width: 100%;'></div>
And finally we can define the component in app/assets/javascripts/components/column-chart.js.coffee:
Dashboard.ColumnChartComponent = Ember.Component.extend
  tagName: 'div'
  classNames: ['highcharts']

  contentChanged: (->
    @rerender()
  ).observes('series')

  didInsertElement: ->
    $("##{@chartId}").highcharts({
      chart: { type: 'column' },
      title: { text: 'Revenue by Product' },
      legend: { enabled: false },
      xAxis: {
        title: {
          text: 'Product Number'
        }
      },
      series: [{
        name: 'Quantity',
        data: [4, 4]
      }, {
        name: 'Revenue',
        data: [10.0, 10.0]
      }]
    })

  willDestroyElement: ->
    $("##{@chartId}").highcharts().destroy()
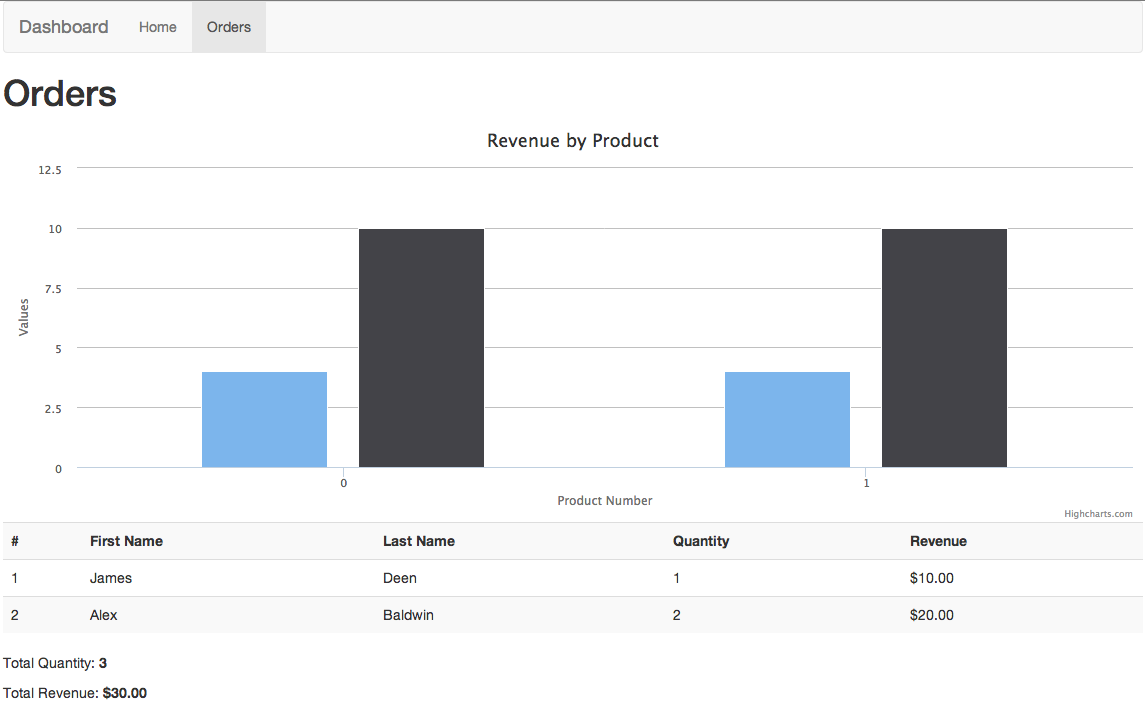
Then when you reload the page it should look like this:
Binding Data To The Ember Component
The chart we have is currently always showing the same series because we hard coded it in the component. Let’s now make this dynamic by adding the data in the route and using data bindings.
First let’s update the data in our orders route to include a product id.
# app/assets/javascripts/routes/orders_route.js.coffee
Dashboard.OrdersRoute = Ember.Route.extend({
  model: ->
    [
      {
        id: 1,
        firstName: 'James',
        lastName: 'Deen',
        quantity: 1,
        revenue: '10.00',
        productId: 0,
      },
      {
        id: 2,
        firstName: 'Alex',
        lastName: 'Baldwin',
        quantity: 2,
        revenue: '20.00',
        productId: 1,
      }
    ]
})
And then we can build our chart series in the orders controller (this is a very simplistic example):
Dashboard.OrdersController = Ember.ArrayController.extend({

  ...

  chartSeries: (->
    revenues = @map((order)->
      parseFloat(order.revenue)
    )
    quantities = @mapBy('quantity')

    [
      {
        name: 'Quantity',
        data: quantities
      },
      {
        name: 'Revenue',
        data: revenues
      }
    ]
  ).property('@each')

})
We can then bind chartSeries in orders.hbs:
<h1>Orders</h1>


<table class='table table-striped'>
And finally use series in our chart component:
# app/assets/javascripts/components/column-chart.js.coffee
...
didInsertElement: ->
  $("##{@chartId}").highcharts({
    chart: { type: 'column' },
    title: { text: 'Revenue by Product' },
    legend: { enabled: false },
    xAxis: {
      title: {
        text: 'Product Number'
      }
    },
    series: @series
  })
...
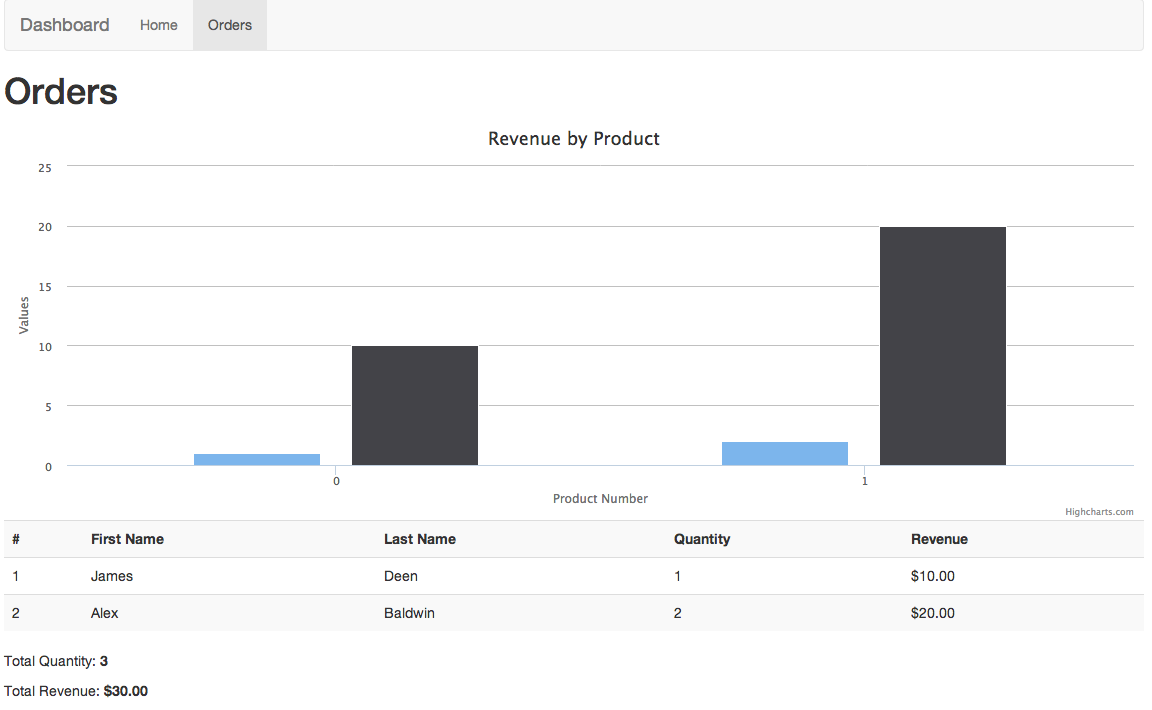
We then end up with our final dynamic chart rendered by Ember: